Simply the BEST unknown pattern for
spotting mid-term tops and bottoms
on the S&P 500 Index!...
spotting mid-
Take a look at the chart below:
The chart above encompasses the period from February, 2001 to October, 2001. At the time, the S&P
500 Cash index had formed a March bottom - and then witnessed a huge rally into the month of May.
Then, on May 21, 2001 a specific pattern occurred that signaled an alert to mid-term traders that
an important market top was about to form! The day that pattern occurred is market with a red
arrow on the chart above.
500 Cash index had formed a March bottom -
Then, on May 21, 2001 a specific pattern occurred that signaled an alert to mid-
arrow on the chart above.
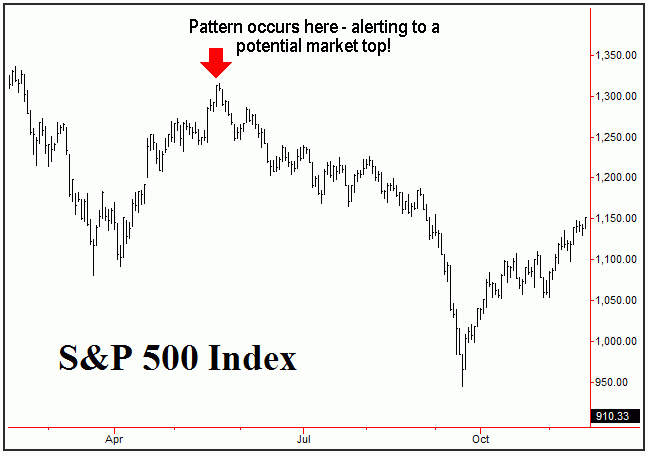
From this chart, once this particular pattern that I am describing occurred, you can see that we were only
one trading day away - and only 3 points - from one of the more important tops in stock market history.
From a high of 1315.93, the S&P 500 then proceeded to decline a whopping 371 points (28.2%) into
The major low that was seen on September 21, 2001!
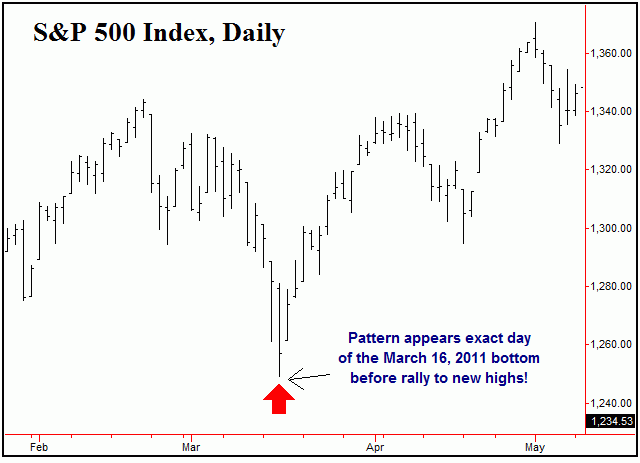
Now, fast forward all the way into 2011. The chart below shows the same pattern appearing the exact day
of the March 16, 2011 bottom - just before a rally was seen that took the index to new highs for the
year in the following months:
one trading day away -
From a high of 1315.93, the S&P 500 then proceeded to decline a whopping 371 points (28.2%) into
The major low that was seen on September 21, 2001!
Now, fast forward all the way into 2011. The chart below shows the same pattern appearing the exact day
of the March 16, 2011 bottom -
year in the following months:
I should add that that the March 16, 2011 low was not the only time that the pattern appeared on the SPX.
One most recent occurrences was seen just prior to the October 4, 2011 bottom. In fact, the actual
Buy signal that I outline came the very day of that bottom - and is the very reason that I was able to go
long that morning at 1077 SPX CASH - within 3 points of the actual low!
Note that the above is documented in my public advisory service, and was a real-time trade that I held for
several months -
More recently, the pattern appeared again in May of 2012, signaling a semi-important low was
probably closing in on the SPX - once again with the actual buy signal for the same also coming the very
day of the 6/12/12 low of 1266.74.
One most recent occurrences was seen just prior to the October 4, 2011 bottom. In fact, the actual
Buy signal that I outline came the very day of that bottom -
Note that the above is documented in my public advisory service, and was a real-
More recently, the pattern appeared again in May of 2012, signaling a semi-
This pattern/setup described above does not appear often - perhaps only 2-5 times per year.
However, when it does appear, it normally signals an important top or bottom forming.
Newly Released!
I have just completed a 29-page e-book that describes - in detail - the above pattern, how it sets
up, precisely what to look for - and also how to play it if and when it does appear. The book
describes the exact technical requirements for setting up both buy and sell signals; these technical signs
are extremely important for the entries and exits, and - alone - are worth the entire price of the
e-book itself.
The ‘Volatility Reversal Method’ is available for only $20, and can be purchased via pay-pal at
the ‘buy now’ button below (the book is in PDF format).
describes the exact technical requirements for setting up both buy and sell signals; these technical signs
are extremely important for the entries and exits, and -
The ‘Volatility Reversal Method’ is available for only $20, and can be purchased via pay-
In fact, nearly all of the major tops and bottoms of the last several decade have seen some occurance of
this pattern beforehand. This was a setup that I first discovered back in the 1990’s - and it continues to
show up with regularity to this day!
this pattern beforehand. This was a setup that I first discovered back in the 1990’s -
show up with regularity to this day!
After purchase, the e-book will be emailed to you within a few minutes (but could take longer, depending on
the time of day). Thank you for your interest!
